I understand that I'm barely touching the tip of the iceberg here regarding room modes/acoustics. The assignment that I attached was like...a beginner's introduction to room modes.
That being said, although I know that more must/should be done to manage the acoustics in our room, for peace of mind (I'm going crazy trying to figure out what I did) my goal is just to figure out how I ended up diagramming the attached image as I did. Per our teacher's instructions, I correctly did the assignment (this can be confirmed by the "checkmark" he wrote on the paper LOL).
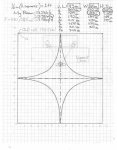
The attached picture (my assignment from school) shows you my findings. Now, I remember everything he showed us: measuring out the room, applying the dimensions into Bob Gold's Room Modes Calculator, finding the frequencies within 6hz...
Whether it could be more accurate or not, or I need to do more, etc...it would just be great to remember how I did what I did...because I completely forgot how/why I drew out as many nodes as I did.
Can anyone give me the answer to this? I know it's gotta do with how many groups of frequencies are very close to each other (as shown by the circled frequencies on my attachment), right???
If someone can help me figure out how I plotted those two nodes on my assignment...it would be highly appreciated.
Thanks so much everyone,
_Christopher
That being said, although I know that more must/should be done to manage the acoustics in our room, for peace of mind (I'm going crazy trying to figure out what I did) my goal is just to figure out how I ended up diagramming the attached image as I did. Per our teacher's instructions, I correctly did the assignment (this can be confirmed by the "checkmark" he wrote on the paper LOL).
The attached picture (my assignment from school) shows you my findings. Now, I remember everything he showed us: measuring out the room, applying the dimensions into Bob Gold's Room Modes Calculator, finding the frequencies within 6hz...
Whether it could be more accurate or not, or I need to do more, etc...it would just be great to remember how I did what I did...because I completely forgot how/why I drew out as many nodes as I did.
Can anyone give me the answer to this? I know it's gotta do with how many groups of frequencies are very close to each other (as shown by the circled frequencies on my attachment), right???
If someone can help me figure out how I plotted those two nodes on my assignment...it would be highly appreciated.
Thanks so much everyone,
_Christopher